Compare Questions Report
The Compare Questions Report helps you see how results change across multiple surveys. Instead of viewing a single score, you can compare categories and questions side by side to spot progress and areas for improvement.
You can use this report to analyse the following question types:
- Agree-Disagree
- Yes-No
- 0-10
- Multi-choice
- NPS
How to generate this report
To generate the Compare Question Report:
- Select Compare in the left menu or the Compare surveys button within a survey's reports.
- Select the surveys you want to compare.
- Review the questions matched between surveys and make changes as needed. When you're happy with the matches, select Build reports.
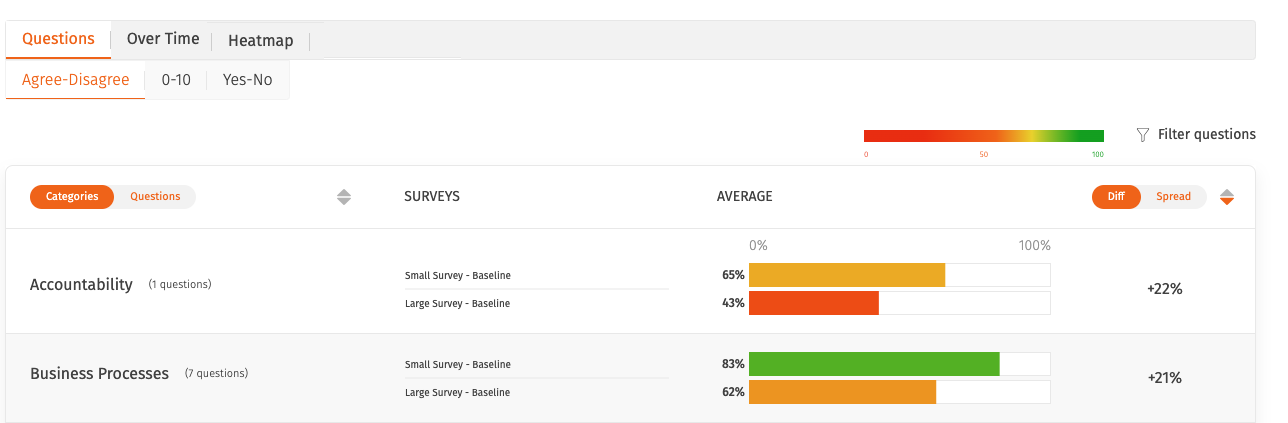
- You will be shown the Questions Report for Agree-Disagree categories by default. You can use the toggle to switch to question view, or use the tabs to explore other question types.
What is the 'Diff' and 'Spread'?
The 'Diff' and 'Spread' reflect two calculations that you can use to analyse Agree-Disagree and 0-10 questions.
- Diff: This is an abbreviation of 'Difference'. It is the latest survey score minus the oldest. It uses the surveys' end dates and is shown as a +/- number to show either an increase or decrease in scores.
- Spread: This is the highest score minus the lowest. This uses the surveys' average score and shows the spread of the average scores across all surveys being compared.

Action counts
Each question and category row displays an action icon with a count for each survey, showing how many actions have been created from that question or category in that survey. Hover over the icon to open a tooltip previewing the actions, including their title, due date, and status. Select Show all actions (or Show action if there's only one) in the tooltip to open the actions list pre-filtered to the survey and question or category you clicked.

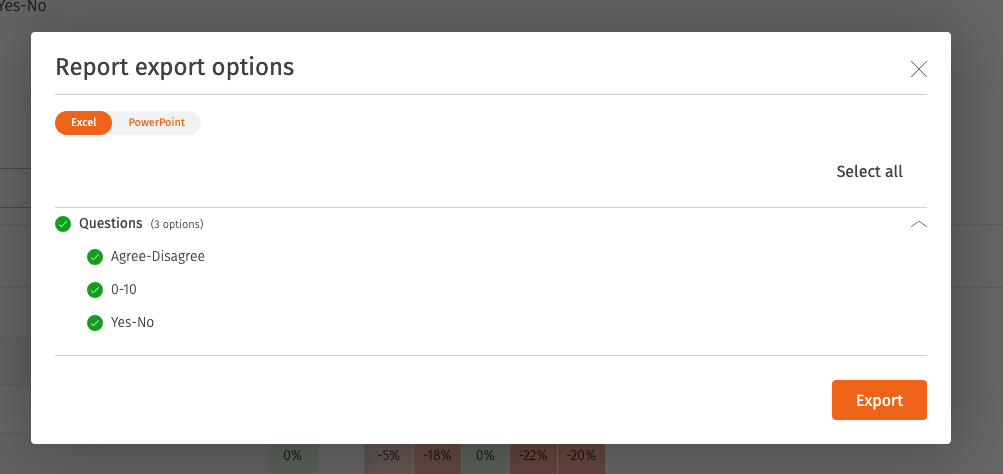
How to export this report
You can export the Compare Questions Report in the following formats: Excel and PowerPoint. The export will contain the category and question scores, broken down by survey.