
Using filters to explore your reports
Filters help you focus on specific information. Whether you want to see how particular groups responded or highlight key themes, filters give you flexibility to explore your data.
You can filter by:
- Demographics: Find out how different groups of people answered. Demographic filters are based on the categories included in your survey (like location, department).
- Question, Group, Themes and Categories: Drill down to granular content. This can be useful when sharing reports and highlighting key points.
How to apply filters
To filter survey results by demographics:
- Select Apply filters at the top right.
- Choose a filter category and option. You can apply more than one filter at once.
- Select See results.
Using demographic filters?
The number of respondents in your filtered results shows in the top right corner of the 'Apply filters' modal. For example, 71 of 163 means there are 71 respondents that match the selected demographic filters out of a total of 163 respondents.
If too few participants match your selected demographics, you may not have enough to meet the minimum response threshold and results won't display. In that situation, try broadening your selection by including more demographics.

💡Don't forget to group 'Other' responses. If you allowed participants to enter their own response for a demographic, we'll prompt you to group them when you open the filters. Grouping responses entered under 'Other' can make your results easier to analyse and helps ensure you don't miss any insights hidden under the surface.
Viewing and changing your applied filters
Once you have applied filters, a "Filters applied" bar appears just below the report tabs. Each filter shows as a chip, for example "Department:Finance +2", so you can see at a glance what your results are filtered by.
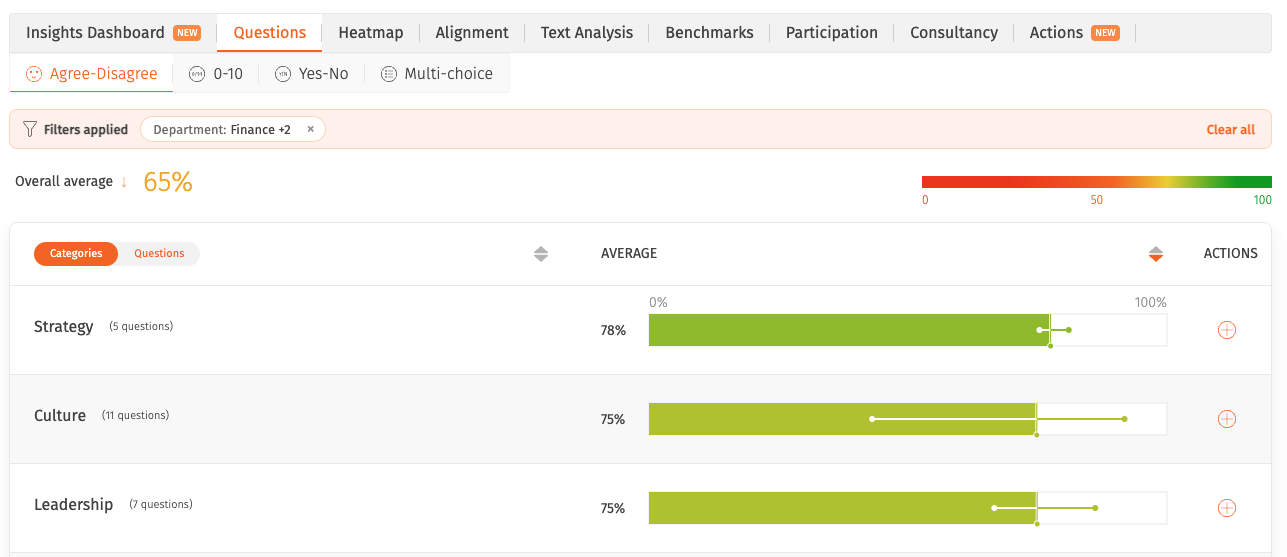
A chip like "Department:Finance +2" means three departments are selected: Finance plus two more.
From this bar you can:
- Edit a filter: select the chip to reopen that filter and change it.
- Remove one filter: select the x on the chip to remove just that filter and keep the rest.
- Clear everything: select Clear all to remove all filters at once.
If a chip shows a count like "+2", hover over it to see the full list of selected values.
What demographic categories are available in my reports?
To find out which demographic categories are available to you, select the information icon next to the report name. This will open a panel displaying information about the survey and which demographics' results you have permission to view.
If you think your permissions are incorrect, please get in touch with the person at your organisation who manages your AskYourTeam account.
Clearing report filters
The quickest way to clear filters is from the "Filters applied" bar below the report tabs:
- Select Clear all to remove every filter, or
- Select the x on any chip to remove just that one filter.
You can also clear everything from the report header:
- Select Filters applied from the report header.
- Select Clear filters.
- Select See results.
What do 'blanks' mean?
You might see ‘Blanks’ appear in reporting filters or in the reports themselves.
This means a demographic option is missing.
It can happen for two reasons:
- The option was removed from the survey or the demographic library — either because it was no longer needed or to prevent others from filtering by that group.
- A participant was missing that demographic information in the library when they completed the survey.
